
Bitcoin dropped about 29% in the last four days of last week - just shy of our $8000 target before the drop. How do we use Elliott wave theory to measure the extent of this fall? What should we expect next?. The following analysis is based on 13 November Bitcoin Elliott wave analysis and forecast.
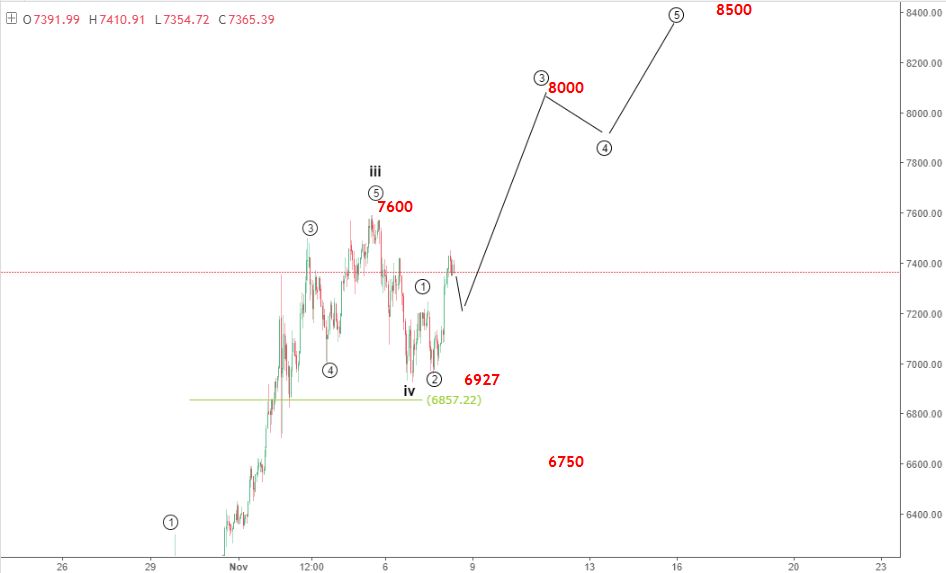
13 November, AtoZForex - In the last update, we expected a strong rally above $7600 with the first target at $8000 and second at $8500. This was as a result of the completing of the 4th minute-wave. The 5th wave was expected to extend above $8000. What happened afterward?. price broke above $7600 and very close to $8000 before the fast drop to $5584 - about 29% drop. The Crypto market especially Bitcoin has been volatile throughout the year. The year saw price rally in an impulsive wave. This drop is like the biggest in the year rally. Has the bears taken control or it's an opportunity for buyers to make more profit from a lower price?. Let's review the last update shown in the chart below.
Bitcoin Elliott wave analysis, H1 (click to zoom)
Multibank ReviewT&Cs apply, 18+eToro Review74% of retail investor accounts lose moneyCapital.com Review76% of retail CFD accounts lose moneyBefore the break, we may see an intraday dip to $7200-7250 which will make a better price. Alternatively, if price refuses to break above $7600 and break below $6927 instead, the next level for bullish opportunity is $6750.
The last update expected price to rally so as to complete the sub-wave 5 of the 3rd wave since the beginning of the year. With price not being able to sustain the break above $7600 and later made a dip, we have adjusted our long term wave count as shown below.
13 November Bitcoin Elliott wave analysis: daily view?
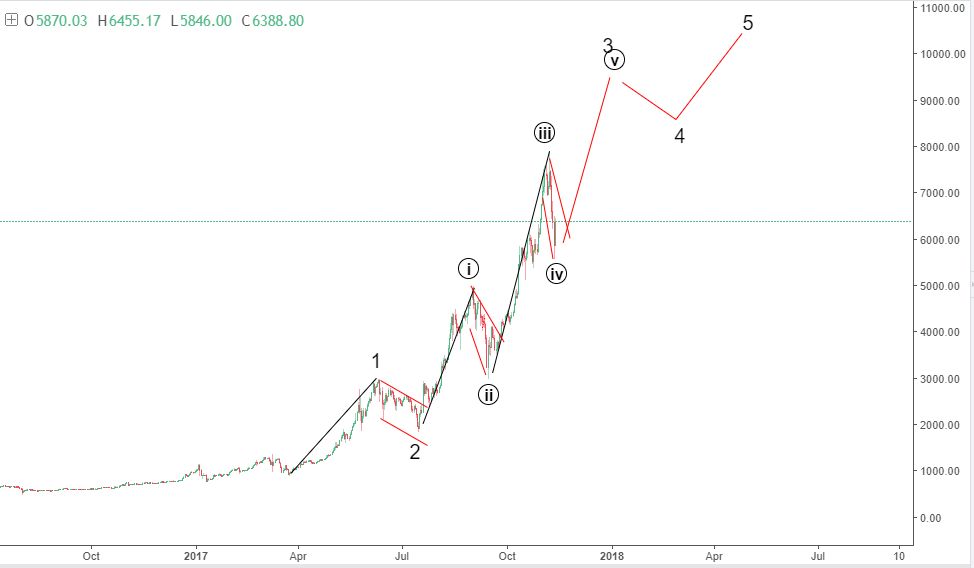 Bitcoin Elliott wave analysis, Daily (click to zoom)
The chart above shows the sub-wave iii of 5 (circled) to have completed. The recent dip is the 4th wave which must stay above 4988 (wave 1 top) to still validate this impulse wave rally. The next rally, if this wave count plays out, will target $9000. The chart below shows the hourly time frame.


13 November Bitcoin Elliott wave analysis: hourly view
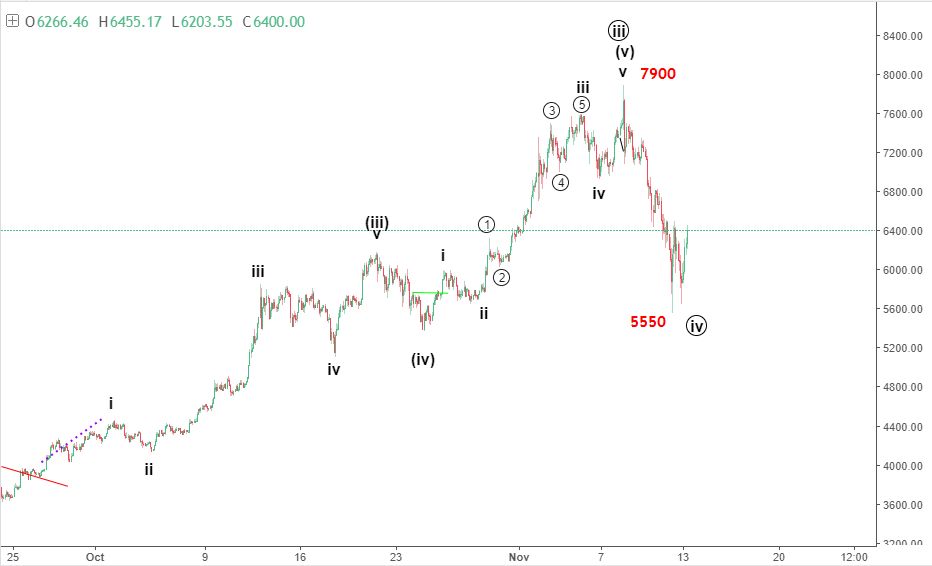 Bitcoin Elliott wave analysis, H2 (click to zoom)
We should expect a break above $6800 leading to a break above $7900 en-route to $9000. Alternatively, if price stays $6800 and breaks below $5550, there will be a strong dip to $4500. Stay tuned for the next update.
Do you have other views in contrast to the ones listed or you want to compliment them further? let’s know by your comment below.
Don’t forget to share this analysis with people that matter to you.