
CADJPY is probably set for more bullish move. More than a month ago, we picked the bottom of this move and price has surged higher since then. After the sharp bearish correction, should we now expect price rally stronger?. The following presents our updated view based on 13 June CAD JPY Elliott wave analysis.
13 June, AtoZForex On this platform, we have identified some real profitable trade setups that are based on Elliott wave theory. These setups, apart from the fact that they are 70% or more successful, they are capable of giving mouth-watering profits. Picking the top of a new bearish move or the bottom of a new bullish move is surely every trader's fantasy. No technical methods give this more than Elliott wave theory. On 2 May, we spotted a bullish setup on CAD JPY with 1000 Pips potential. The pattern identified was a long term double zigzag. The chart below was used.
 CADJPY Elliott wave analysis, H8 (click to zoom)
The correction shown above is another double zigzag pattern formed within a channel. Also important is the Fib-ratio cluster which formed a strong support. 161.8% Fib-projection of wave (w) from (x) and 61.8% Fib-retracement of wave (a)
The double zigzag completed and price broke upside. A 1000 Pips or more rally was expected. This is a long term trade opportunity that could take months to complete. Elliott wave patterns can be seen in all time frame from minutes to monthly charts. The chart below shows the new updates.
13 June CAD JPY Elliott wave analysis: what next?
 CADJPY Elliott wave analysis, D1 (click to zoom)
The chart above shows a good breakout before price made a deep correction. An impulse wave breakout is very likely here. The breakout and the correction have been labelled wave (i) and (ii). A break above the top of (i) will even strengthen our stance of the strong rally in the coming weeks. The chart below shows the sub-wave of the beginning stages of wave (iii).


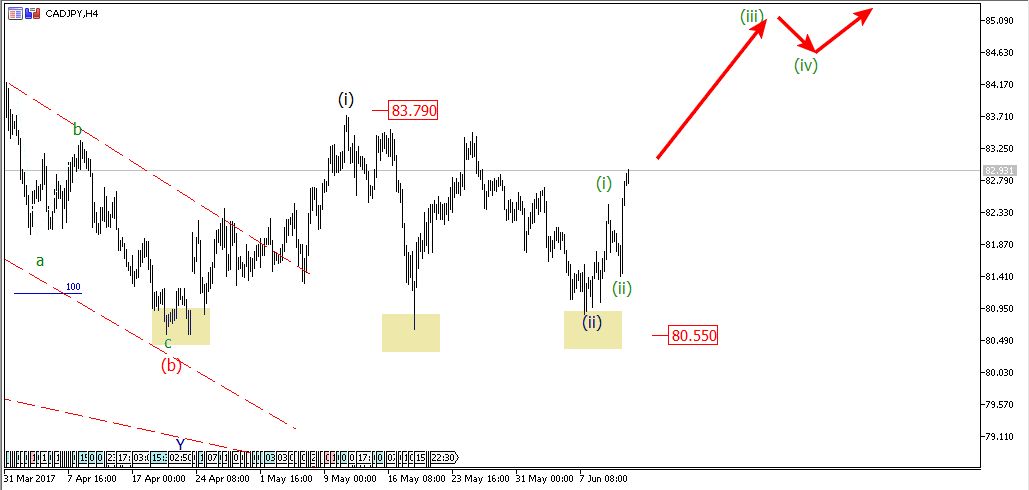 CADJPY Elliott wave analysis, H4 (click to zoom)
A long term trader can take this advantage with stop loss at 80.55 and watch as price breaks above 83.79. Price was also rejected after making 3 attempts to break below 80.55 to from triple bottom. All these technical rejections mean one think: high likelihood of a big rally. More updates will come later.
Do you have other views in contrast to the ones listed or you want to compliment them further? let’s know by your comment below.
Don’t forget to share this analysis with people that matter to you.