
During the weekly market opening Crude oil gapped up based on optimism arisen from major banks' expectations that OPEC will cut oil output on the 30th November. Technically, Crude oil Elliott wave analysis is in support of price advancing further above $52 if all goes well in Vienna.
21 November, AtoZForex - Most part of this year witnessed a serious improvement in the Oil prices after 3 years of price crash. The crude oil crash started in 2013 and ended late 2015 endangering the oil producing economies globally. Since the beginning of this year, crude oil prices have seen a low of $26 and a high of $52 per barrel, and have been ranging between $40 - $50 levels.
Oil price rose to its highest this year after the meeting in Algiers. This resulted into an agreement which was expected to yield positive result when the official meeting in Vienna is held on 30th November.
Crude oil Elliott wave analysis: Does Elliott wave theory support continuous rally?
The Elliott wave theory is in support of this as will soon be shown.
 Weekly Crude Oil Elliott wave analysis chart (click to zoom)
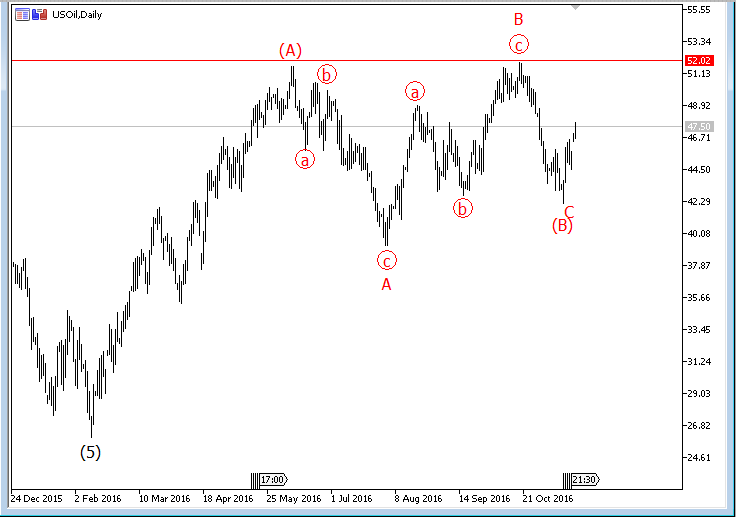
The weekly crude oil Elliott wave analysis chart shows Oil prices declining with an impulse wave which is expected to correct upside. According to the Elliott wave theory, a five wave decline is followed by a 3-wave correction in the opposite direction. The first leg of the expected correction covered most of the first half of the year after which a 3-wave followed. What this shows is that the 3-wave correction expected is a Zigzag (A-B-C) pattern. If the Zigzag pattern completes as expected, we will expect Oil price rally to continue in the first half of 2017 to $68.


Presently, price is in the second leg of the expected Zigzag pattern as shown below.
 Daily crude oil Elliott wave analysis chart (Click to zoom)
The wave (B) shown above has completed a flat (3-3-5) pattern to which price is responding. A rally above $52 is expected. The sub-wave of the Flat pattern is shown clearly above.
 4 hour crude oil Elliott wave analysis Chart (Click to zoom)
Where does it go from here? Levels to watch out for
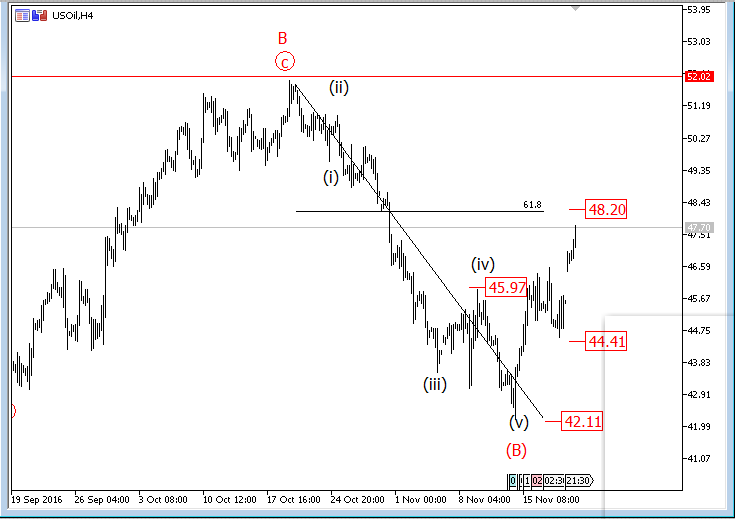
The Flat pattern ended with an impulse wave at $52 as shown above. Price rose to break above $45.97 thereby lunching the drive upside. The next price level to watch out for is $48.20 and its neighborhood.
In the coming days, price will be hovering between $42 and $52 with $48 and $44.5 in between. The meeting will cause momentum break out from the extremes of the levels.
If we see the OPEC meeting in Vienna on the 30th of November come with production cut, with no doubt we will see the oil price rally. Thus, we could expect oil to rally towards $52 en route to $68 as the year closes. If the result on the other hand is negative, we may see the Flat pattern continuing its formation downside to $39-$40 or even below to form another pattern entirely.
We will update the Elliott wave analysis of Oil before, during and after the meeting on AtoZforex.com
Do you have other views in contrast to the ones listed or you want to compliment them further? let’s know by your comment below.
Don’t forget to share this analysis with people that matter to you.