
GBPJPY has probably completed a pattern downside that could lead to a bullish resumption in just about a week to the U.K general election. Can this be a bullish setup to 1000 Pips? The following discuss the complete corrective pattern based on 1 June GBP JPY Elliott wave analysis.
01 June, AtoZForex - The basic tenet of the Elliott wave theory is that the price of any financial instruments publicly traded advances or declines in 5-waves and corrects in 3-waves against the direction of the trend. This however can be seen on any time frame and it doesn't really matter what has been happening. This phenomenon repeats itself over again on every time frame. After the 5-3 wave move, we can have a complete cycle of that degree. This is the basics. At the end of the 3-wave correction, price usually continues in the direction of the trend (of the same degree) in another 5-waves which could be shorter than, equal to or greater than the first 5-wave. If the 5-wave resumption is greater, we are likely going to have an impulse wave of the immediate larger degree. These behaviors are price wave patterns that are well defined.
A case study can be seen in the hourly price chart of GBPJPY when price fell after it completed a 5-wave rally. The bullish move started in mid-April and ended early May. Price afterwards corrected in 3-waves as shown below.
1 June GBP JPY Elliott wave analysis: 1000 Pips rally?
 GBPJPY Elliott wave analysis H2 (click to zoom)
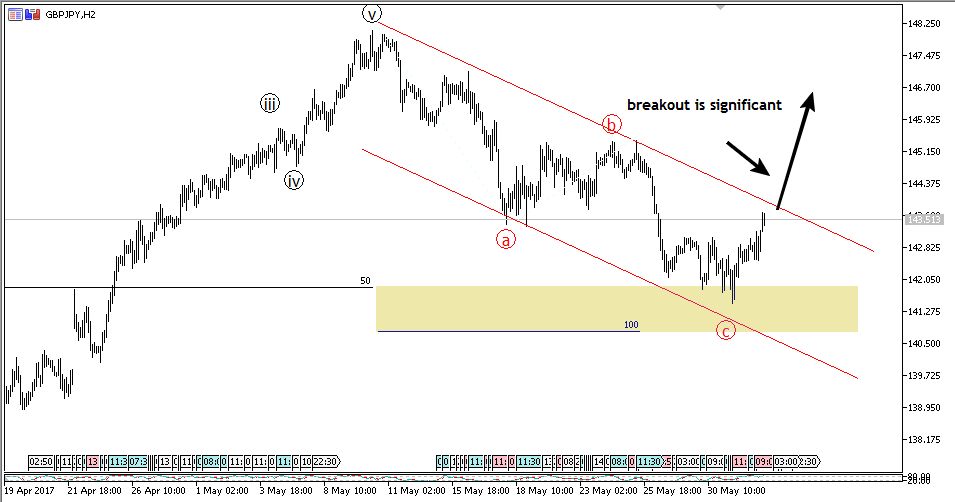
The correction got to the 50% Fib-retracement of the preceding impulse wave. Chart wave patterns are bound together in simple ratios. Price bounced from the highlighted reversal zone and it now looks like a break above the channel upper line is the final confirmation. The chart below shows the sub-wave of the correction.
 GBPJPY Elliott wave analysis H2 (click to zoom)


That's a zigzag pattern - a 5,3,5 bearish corrective pattern. We expect a 5-wave rally to breakout of the channel as price remains above 141.45. Any break below 141.45 with invalidate the zigzag and send price further downside for a more complex corrective pattern. If all moves as expected, there is a potential for more than 1000 Pips impulse wave upside. The preceding impulse rally was more than 1200 Pips, we should't expect less if the rally goes as expected. More updates will come later. Stay tuned.
Do you have other views in contrast to the ones listed or you want to compliment them further? let’s know by your comment below.
Don’t forget to share this analysis with people that matter to you.