
Ethereum price is battling to find a balance above $420 after the overarching declines that had it trade below July lows ($417.50). However, are there bullish signals? What does the chart in the following 1 August Ethereum Price Technical Analysis reveal?
1 August, AtoZ Markets – Ethereum dropped approximately 9.82% in less than two days to trade lows of $412.15. It also broke below several support levels at $460, $440 and $430. The selloff is widespread cross the cryptocurrency market.
1 August Ethereum Price Technical Analysis
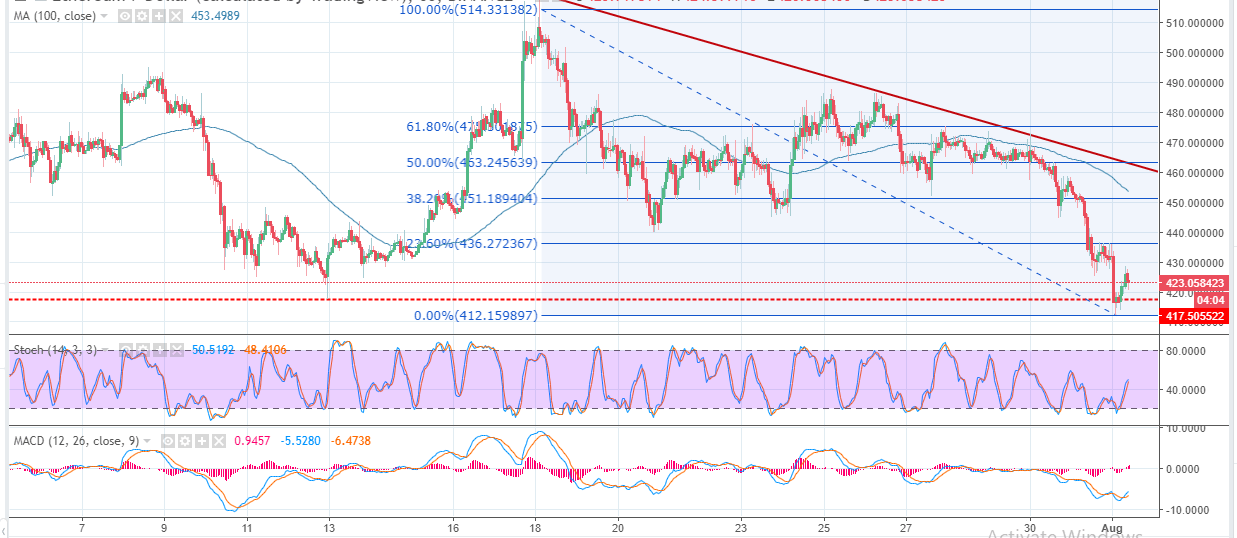
At the moment, technical indicators like the stochastic and the MACD on the hourly chart are showing bullish signals. The immediate resistance is at $428 but the critical upper supply zone is highlighted at $430.
On the flip side, the price must embrace the short-term support at $420 to prevent declines that could have the second largest cryptocurrency in the world drop below $400.
ETHUSD 1-hour chart
Think we missed something? Let us know in the comments section below.