Two oscillating indicators are the basis of DSS Bressert Forex Trading Strategy. Both confirm the trend and the other confirms overbought or oversold territory. Combining these indicators increases the likelihood of a winning setup.
The Bressert indicator, an oscillating indicator, has a similar structure and characteristic to the stochastic oscillators. It has the same characteristics as the stochastic oscillator and has both fast and slow lines. There are also overbought areas and oversold ones. The difference is however its smoothened characteristic.
The Bressert indicator, unlike the stochastic oscillator which plots highly responsive lines of graphs, is smoother.


How to trade using DSS Bressert Forex Trading Strategy
The buy setup - entries, stop losses & exits
These rules must be followed in order to initiate buy orders:
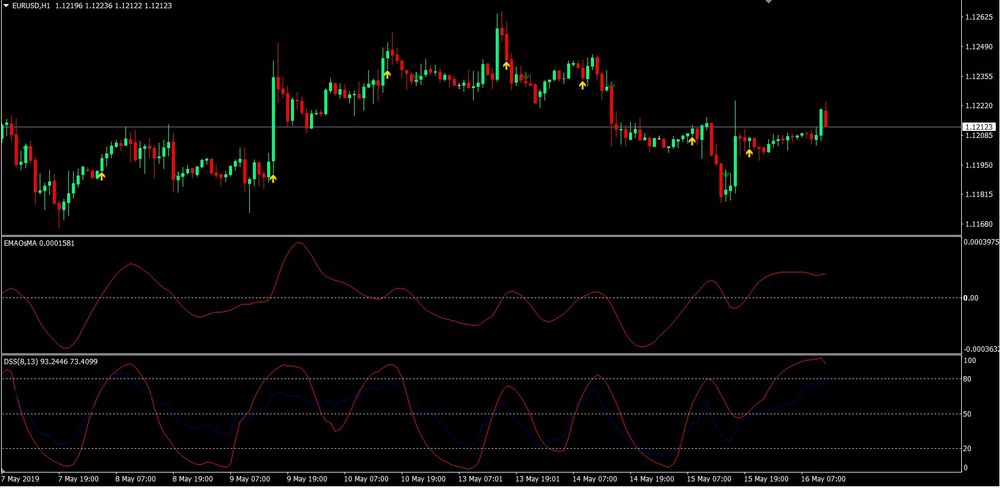
- The EMAOsMA indicator crosses the zero line, indicating that prices are being pushed up
- The Bressert indicator has both lines above the 50-line, indicating bullish market sentiment but not quite in the overbought territory.
- The price chart shows a gold arrow with a pointed up signifying the entry candle.
Like the Bressert indicator and want to try it out? Do it with an AtoZ Approved broker for free:
Stop Loss A stop loss should be placed just a few pips lower than the most recent minor swing low.
Exit: To exit a trade, close it manually as soon as the Bressert indicator crosses the blue line going downward. This will indicate that the market's bullish bias may be waning or could soon reverse.
The Sell Setup - Entry, Exit and Stop Losses
These rules must be followed in order to enter a sale trade using this strategy:
- The EMAOsMA indicator crosses the zero line, indicating that prices are being pressured downward
- The Bressert indicator has both lines below the 50-line, indicating that market sentiment is bearish but not in the oversold zone.
- The price chart shows a dark green arrow that points down, indicating the entry candle.
Stop Loss A stop loss should not be more than a few pips from the latest minor swing high.
Exit In order to take profits, close the trade manually as soon as the red line of the Bressert indicator crosses the blue line.
How to download and install an indicator?
In order to install the indicator on your MT4 platform, you need to follow these steps:
- Click on “Download Indicator” button located at the bottom of the post.
- Save the file to your computer.
- Extract and move the files into MT4>Indicator folder of the MetaTrader4 software file directory.
- Restart your Metatrader platform.
- Navigate to “Indicators.”
- And select “DSS Bressert Forex Trading Strategy” template to apply it on the chart.
Note: This indicator was developed by FxKings. AtoZ Markets does not carry any copyrights over this trading tool.
Should you use the Bressert indicator on your own at all?
Before you start trading with this Bressert indicator for MT4, you'll want to read this.
Our in-house trading expert Dr Yury Safronau, PhD in Economic Sciences, gives you daily his best forex, metals, and cryptocurrencies to buy and sell signals right now.
His trading strategies which are based on non-linear dynamic models have achieved more than 65 000 pips of profits since 2015. And right now there are some very strong buy and sell signals across several markets you don't want to miss.
Want to see which ones?